The Dashboard is the homepage of the app. It provides a quick overview of your current inventory alerts and your alert settings.
You can access the Dashboard at any time by clicking Dashboard in the navigation bar at the top of app.
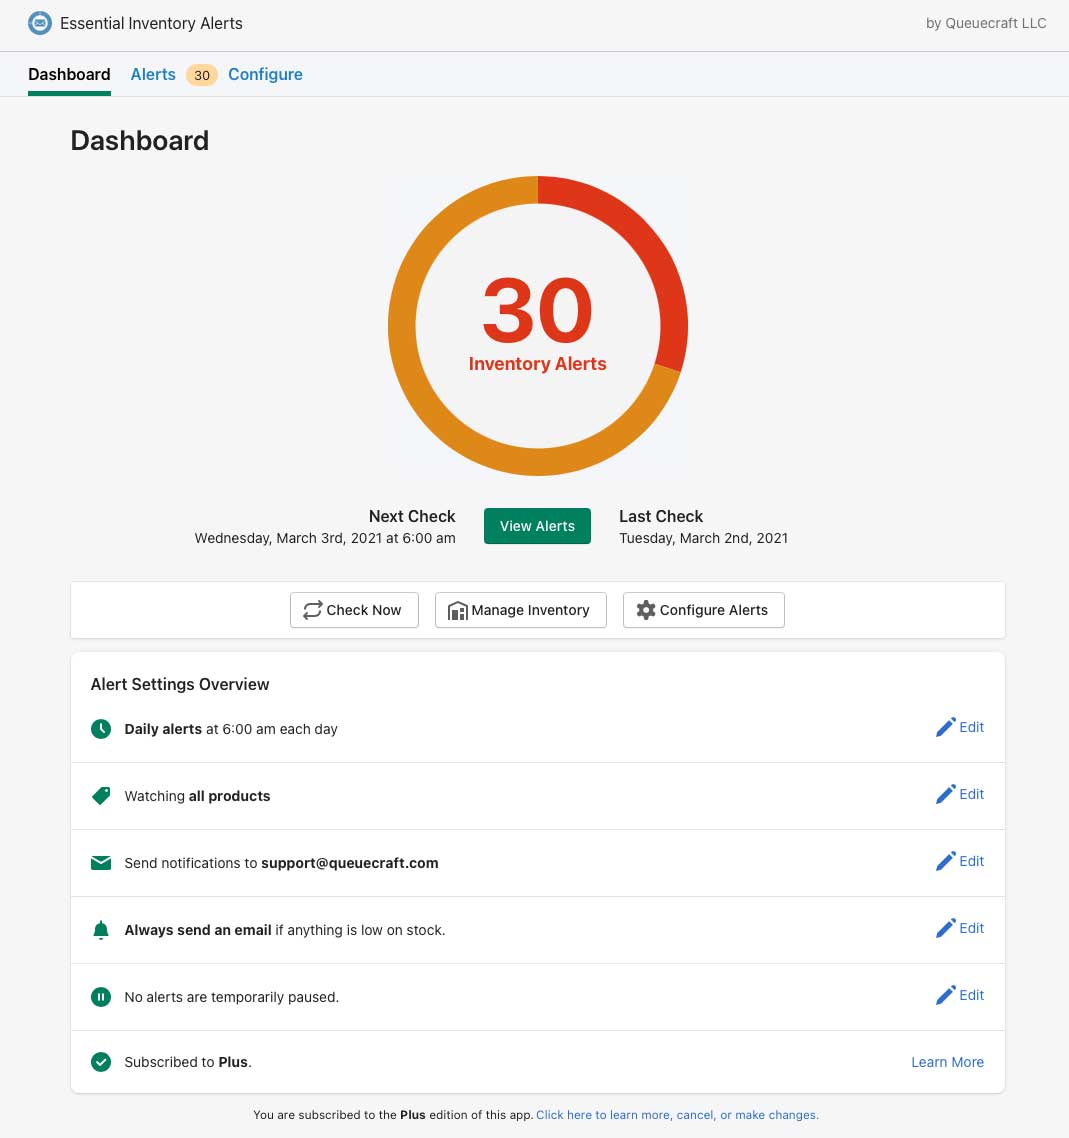
The top part of the Dashboard shows your current alerts.
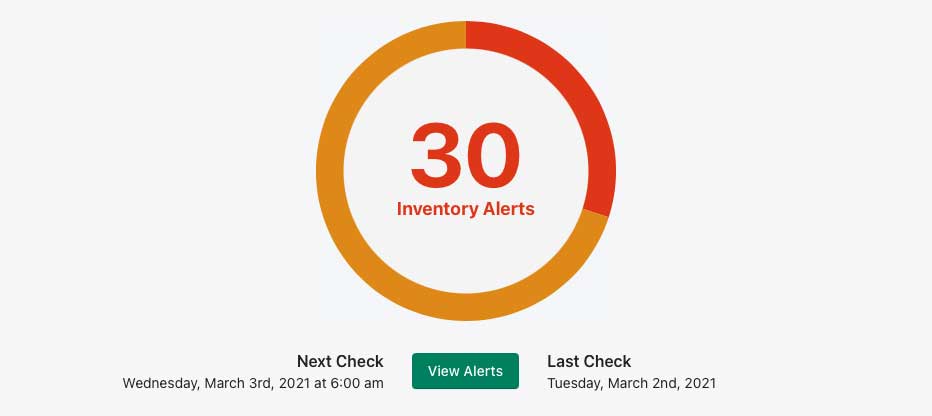
The graph shows your current alerts. The number in the center is the total number of alerts, including both critical and low alerts. The red portion of the circle represents the critical alerts, and the orange portion represents low alerts.
Click the View Alerts button to go to the Alerts screen and view a detailed listing of all your inventory alerts.
Below the graph, you'll see the date and time of your next automatic inventory check. To the right, you'll see the date of your last inventory check.
Below the current alert information, you'll see a set of three buttons.

Last, the Alert Settings Overview gives you a quick glance at the settings used to determine your inventory alerts.
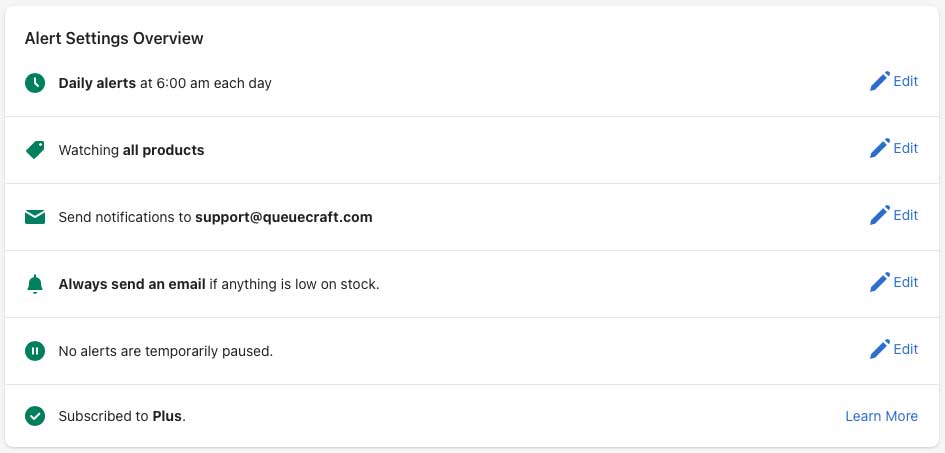
The main settings are displayed here, providing an overview of how your alerts are determined and sent. You can change these settings by clicking Configure at the top of the page, by clicking the Configure Alerts button, or by clicking the Edit button next to a setting.
In order, top to bottom: